China Night Lightmap
Observe Changes Before and After the COVID-19 Pandemic Using Satellite Images
Introduction
Chinese authorities officially suspended travel and closed business activities in late January 2020 in response to the rapid surge of the novel coronavirus. Satellite observations have since revealed significant changes in city-level activities. Starting on December 12, 2019, the first cluster of patients was detected in Wuhan, Hubei province. Beyond health issues, people's day-to-day lives were affected in a myriad of ways.
For instance, the lockdown of cities in China reduced the number of collective gatherings in public spaces, causing an instant reduction in tourism and transportation flow. The restrictions also curtailed economic production because workers could not return to their workplaces, leading to the involuntary shutdown of some manufacturers. The changes varied depending on the outbreak timing and the restrictions put in place by cities and provinces.
The core question this GIS project seeks to answer is the difference in cities' nighttime brightness levels before January 2020 and afterward, quantifying the changes in human activities over time, from before the pandemic to the present. The analysis of nighttime satellite images is the primary tool used to depict these changes, as nighttime lighting serves as a reliable and robust data source to observe broader patterns of a city's capacity to adapt to new living conditions and provides fascinating insights into people's activities in adapting to COVID-related restrictions.
Methods & Analysis
Data Collection
Project Criteria
The primary data for this project comes from the Earth Observation Group, a monthly cloud-free DNB composite available on its website. The vcmsl config for the tile in 75N060E (Northeast Hemisphere) is the data set to cover the location of China.
Data Sources
I used night light observations to track variations in cities' energy use based on whether light pollution increased or decreased, which highways were shut down, and which cities kept a status quo. I also included other economic and census indicators to help me better contextualize such spatial outcomes.
First, analyzing the timeline for all the restrictions and lockdowns helped me find a set of comparable timestamps. Using the monthly Day/Night Band (DNB) composite, I could quantify the average amount of light being projected. The monthly composite is relatively meaningful for undertaking year-to-year comparisons. To choose which month to analyze, I divided the timeline into three periods:

Methodology
Removed the outliers and classified the brightness from 0 to 10 for the country's scale. Used the single-band color palette to show the map and generated maps for February 2019, February 2020, and February 2021.
Selected cities for analysis (Wuhan, Shanghai, Shenzhen, Baotou)
Clipped the tiled image for four cities and for months from January to April during 2019 to 2022.
Classified the brightness from 0 to 50 for the city's scale for a better visual representation.
Analyzed the mean brightness for four cities by zonal statistics.
Compared the means and created bar charts for four cities.
Researched cities' GDP growth rate and census data to support the bar charts.
Compared the brightness outside of cities to notice the impact of transportation.
Researched the events during the pandemic in Wuhan since Wuhan had an opposite outcome to other cities.
Calculated the percentage changes in February by subtracting the mean of 2020 from 2019 and graduated by the same color theme to make the thematic map.
Listed the top five increasing and decreasing cities.
Repeated steps 10 and 11 for the changes from 2020 to 2021.
City Selection
To compare fluctuations in city-level activities and their changes throughout the pandemic, this analysis focused on four distinct cities: Wuhan (the epicenter with a prolonged lockdown), Shanghai (China's most populated city), Shenzhen (a major manufacturing hub in the Pearl River Delta), and Baotou (a northern comparator city in Inner Mongolia, rich in rare-earth metals).

National Scale


Insight
Despite the early 2020 lockdown, nighttime brightness — a reflection of activity — steadily and consistently increased.
Provincial Scale


Insight
Provinces in the north, home to heavy industry, experienced decreased nighttime brightness, suggesting the epidemic's impact varied based on the regional industrial structure.
City Scale


Insights
Initial Brightness Anomaly: Nighttime brightness increased immediately following the lockdown on January 23 and subsequently decreased in March. This counterintuitive rise is likely due to several factors:
Population Influx: Wuhan has a lower floating population compared to Tier-1 cities (e.g., Shanghai and Shenzhen). Consequently, fewer people traveled out before the lockdown, and many may have migrated back to Wuhan before the Chinese New Year.
Medical Response: The brightness increase in February reflects the existing population's activity combined with the large influx of medical workers, suppliers, and supporters. The National Health Commission of the People's Republic of China confirmed that over 38,000 medical workers were sent to Wuhan before March 2020.
Road Network Activity: Analysis of the reference map highlighted specific roads connecting to Wuhan downtown. One of the locations correlating with increased lighting along these routes was identified as a temporary mobile cabin hospital for COVID-19 patients.
Commemorative Events: The city hosted a lighting show on April 30 to celebrate the lifting of the ban. The show featured aerial photographs displaying the "Wuhan Fighting" slogan, a visual tribute to the city's effort.


Insights
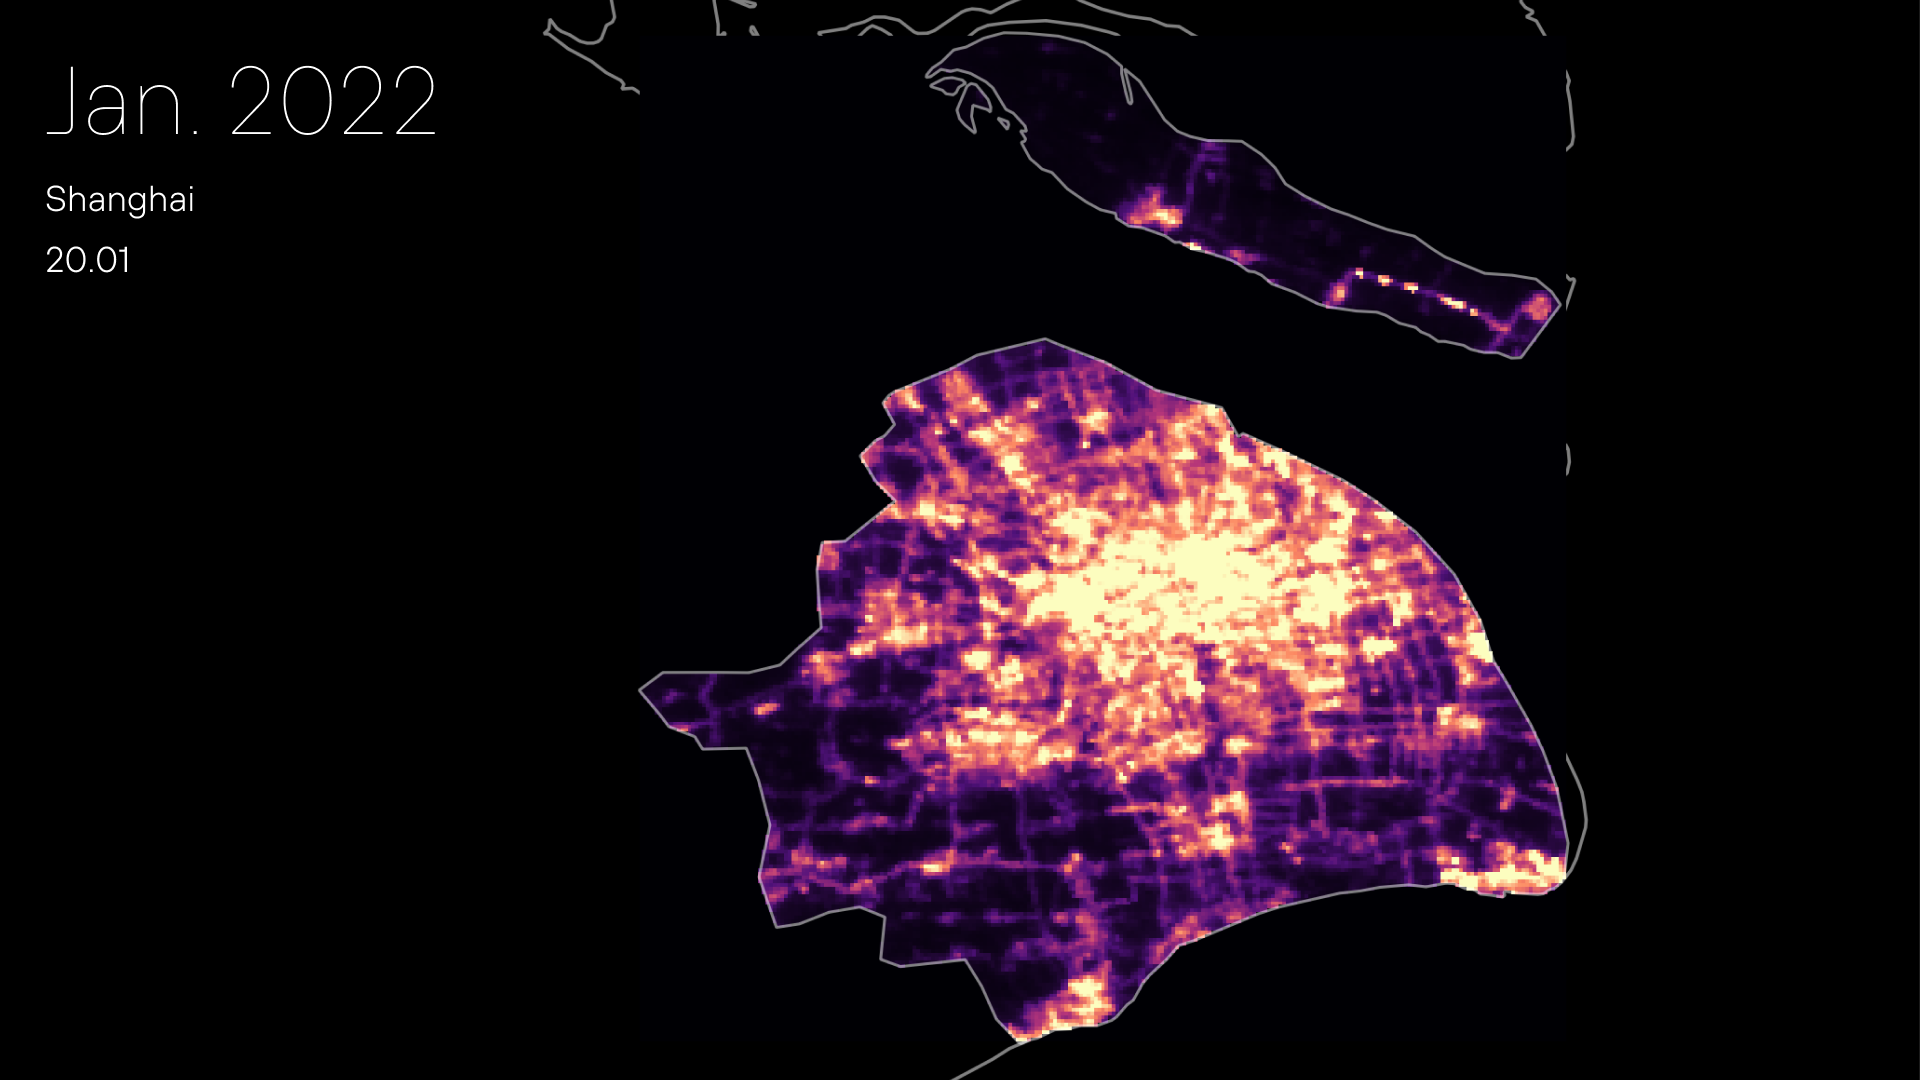
Shanghai exhibited a stable trend in human activities (brightness) from 2019 to 2022, with the drop in February 2020 being insignificant.
In contrast, the brightness level sharply dropped in April 2022. This decline directly corresponds to the lockdown timeline, as this period represented the city's first and most stringent lockdown since 2020.


Insights
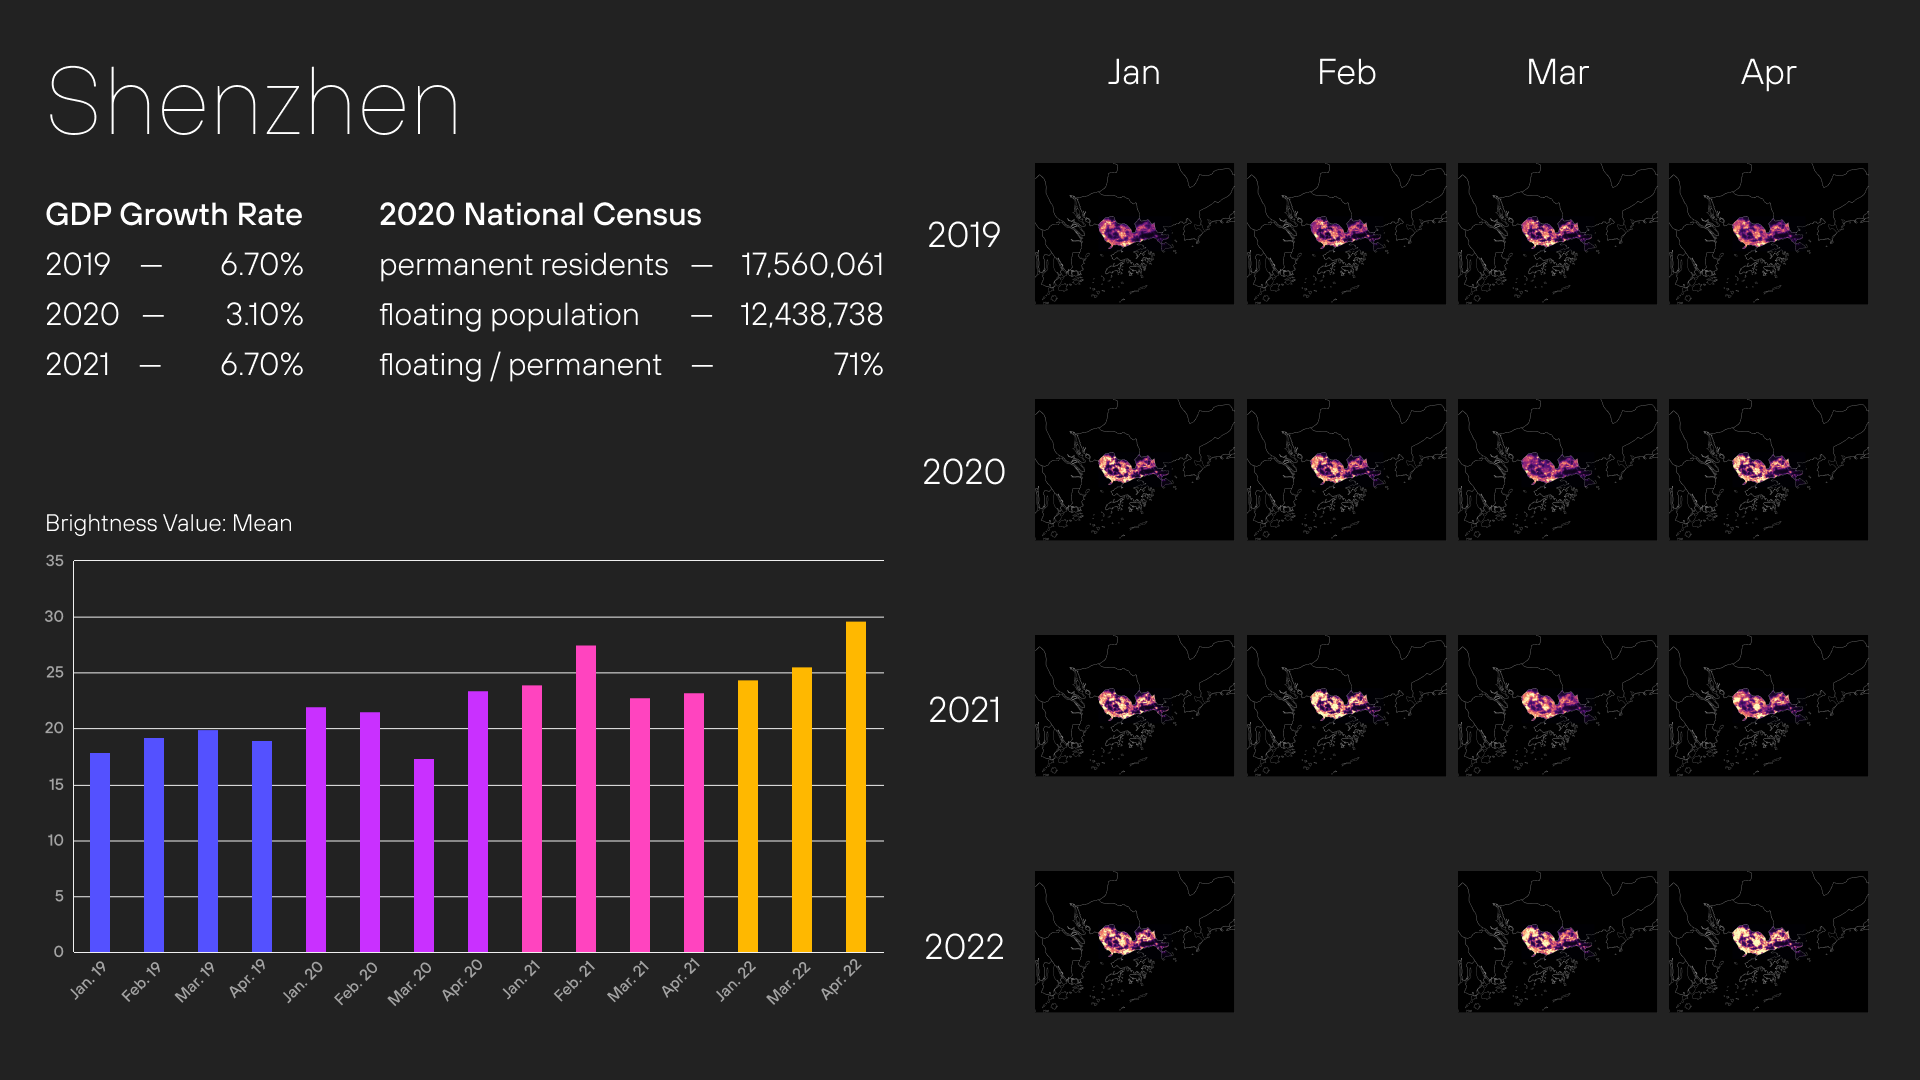
During the four-month period in 2020, a significant drop in brightness was observed in March, corresponding to the implementation of new restrictions. Due to the strict enterprise resumption report system, many workers could not return to their jobs; the return-to-work rate was only 68.7% (Source: The State Council The People’s Republic Of China).
Following March 2020, the brightness trend resumed and reached its highest level in April 2022. This phenomenon is likely related to the city's large floating population.
Transportation near the Pearl River Delta decreased in 2020.
The 2019-2022 visualization shows a centralization of human activities within cities during 2019, 2021, and 2022. Conversely, the purple color in the image set depicts a more dispersed distribution in the 2020 timeframes, suggesting population movement outside the main urban centers.


Insights
Baotou exhibits less nighttime lighting compared to other analyzed cities, a finding consistent with its smaller permanent resident population.
March 2020 recorded the lowest brightness among the analysis months. Although the national trend suggested a higher expected brightness level in 2020, the pandemic's impact was significantly negative in the city. The observed brightness changes from 2019 to 2021 align with the city's GDP growth rate during the same period.
The same outcome (low brightness during the pandemic period) is evident in the Bayan Obo mining district.
The data for 2020 indicates further disruptions in transportation and commuting flows between Baotou and its neighboring towns.
Takeaways
Country
From the country’s scale, we see the brightness increasing yearly.
Province
Provinces with decreased nighttime brightness were generally found in the north, a hub for heavy industry. This geographical pattern suggests that the impact of the epidemic depends largely on the industrial structure of the region.
City
Southern cities demonstrate a higher tolerance for disruption and possess a more adaptive capacity.
In general, these cities did not entirely cease operations during the lockdown. The increase in residential lighting consumption, offset by a decrease in street and public lighting, suggests a shift in human activity from communal to private spaces.
Wuhan displayed an anomalous pattern compared to other cities. The observed increase in brightness in February 2020 shows evidence of heightened activity from busy ambulance services and other essential medical support during the height of the outbreak.
Reference
Meghan Bartels, MB. (2020). New satellite views show impact of coronavirus on emissions, China's night lights. Space.com.
https://www.space.com/coronavirus-
The World Bank. (January 26, 2015). East Asia's Changing Urban Landscape: Measuring a Decade of Spatial Growth.
AP News. (January 22, 2021) Timeline: China's COVID-19 outbreak and lockdown of Wuhan
COVID-19 lockdown in China. (n.d.). Wikipedia. Retrieved Month Day, Year, from
https://en.wikipedia.org/wiki/COVID-19_lockdown_in_China#2020_lockdowns
Nighttime Lights. (2021, May 18). Earth Data NASA.
https://earthdata.nasa.gov/learn/backgrounders/nighttime-lights
Nighttime Images Capture Change in China. (n.d.). NASA Earth Observatory. Retrieved Month Day, Year, from
https://earthobservatory.nasa.gov/images/146481/nighttime-images-capture-change-in-china
Emily Cassidy, EC. (2020, April 3) Nighttime Images Show Changes in Human Activity
https://earthdata.nasa.gov/learn/articles/feature-articles/nighttime-images-wuhan
Bayan Obo Rare Earth Mine. (n.d.). NS Energy. Retrieved Month Day, Year, from
https://www.nsenergybusiness.com/projects/bayan-obo-rare-earth-mine/
包头市第七次全国人口普查公报 2020 [Baotou Seventh National Census communique 2020].
红黑统计公报库.
https://tjgb.hongheiku.com/13665.html
武汉市第七次全国人口普查公报 2020 [Wuhan Seventh National Census communique 2020]. 武汉市人口统计局.
http://tjj.wuhan.gov.cn/ztzl_49/pczl/202109/t20210916_1779157.shtml
深圳市第七次全国人口普查公报[1](第一号)——全市常住人口情况 2020. [communique of the Seventh National Population Census of Shenzhen [1] (No. 1) - the city's permanent population 2020]. 深圳市统计局.
http://tjj.sz.gov.cn/ztzl/zt/szsdqcqgrkpc/szrp/content/post_8772112.html
深圳市第七次全国人口普查公报[1](第六号)——流动人口[2]情况 2020. [communique of the Seventh National Population Census of Shenzhen [1] (No. 6) - Floating Population 2020]. 深圳市统计局.
http://tjj.sz.gov.cn/ztzl/zt/szsdqcqgrkpc/szrp/content/post_8772123.html
“始终把人民群众生命安全和身体健康放在第一位”——中国抗疫彰显“生命至上、人民至上”理念. ["Always put people's life safety and health first" - China's anti-epidemic highlights the concept of "life first, people first"]. National Health Commission of the People's Republic of China.
http://www.nhc.gov.cn/xcs/fkdt/202005/c9eb389e93e44c02a8c1b978ab361abe.shtml
Brian, M., KIM, B., TREVOR, M., RAN G., BENJAMIN, S., WALKER, KB., & DAYNAN, C. (2021, January 21). Light Every Night – New nighttime light data set and tools for development.
Over 38,000 medical workers sent to Wuhan to fight virus. (2020, March 24). National Health Commission of the People's Republic of China
http://en.nhc.gov.cn/2020-03/24/c_80407.htm
范梓萌. 深圳规上工业企业开工率超97% 复工复产进入“快车道” [The operating rate of industrial enterprises above designated size in Shenzhen exceeds 97%, and the resumption of work and production has entered the "fast lane"]. (2020, March 14). The State Council The People’s Republic Of China.